
The January Effect
What a Difference a Year Makes…
2026 is starting off with a bang, maybe not at the index level, where markets generally moved higher in January. Under the surface, however, things began to change dramatically. Let’s explore.
The "January Barometer"—encapsulated by the pithy market phrase "As goes January, so goes the year"—is perhaps the most enduring piece of folklore in the history of Wall Street. First popularized by Yale Hirsch of the Stock Trader’s Almanac in 1972 (my own personal copies go back to 1981), the theory posits that the S&P 500’s performance in the first month of the year serves as a reliable predictive indicator for the remaining eleven months. If January finishes in the green, the year is destined for gains; if it ends in the red, investors should brace for a bear market or, at the very least, significant volatility.
As we stand in February 2026, looking back at the fresh data from the month just concluded, the relevance of this barometer remains a central point of debate among institutional strategists and retail investors alike. To understand what 2026 may hold, we must first peel back the layers of history, look at the drivers behind the trend, and the specific macroeconomic factors currently shaping the global landscape.
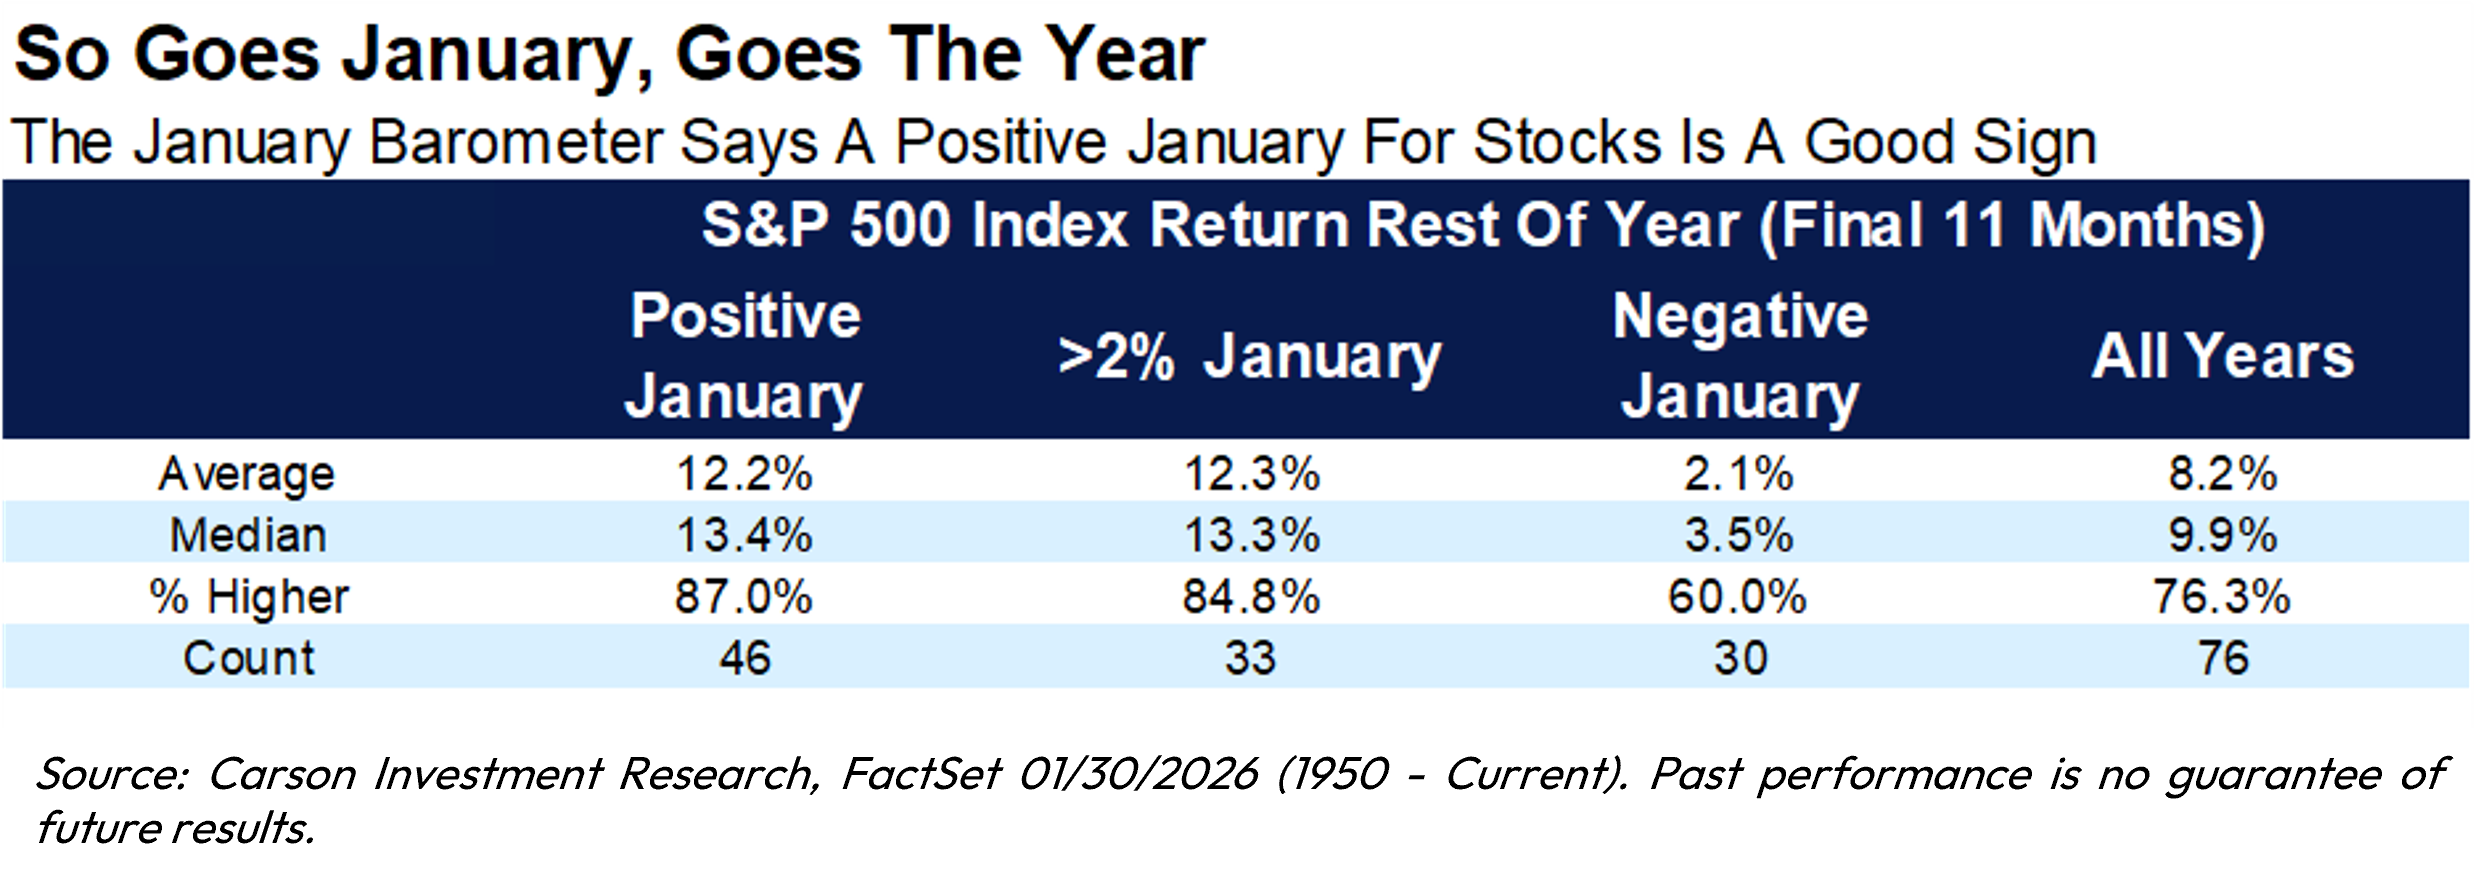
I have long talked about institutional money coming into the market in January and positioning itself for the year ahead. The reason for this belief is that historically, the January Barometer has boasted an impressive, though not infallible, track record. Since 1950, the barometer has been right approximately 83% of the time, as it seems to reflect a broader phenomenon of market momentum. When the market ends January on a high note, it often indicates that institutional "smart money" has finished its rebalancing and has committed to a bullish posture for the year.
The statistics are even more compelling when January is positive. In years where the S&P 500 rose in January, the average full-year gain has historically hovered around 13%. Conversely, when January is negative, the "flat-to-down" years become far more frequent.
Why does a single month carry such weight? Several technical and psychological factors contribute to the "January effect":
At the start of the year, pension funds, 401(k) contributions, and institutional portfolios receive fresh infusions of cash. Where this money flows in January often dictates the "path of least resistance" for the months to follow.
Historically, small-cap stocks tend to outperform in January. This is often driven by "tax-loss harvesting" in December, where investors sell losers to offset gains, only to buy back into the market in January, creating a localized surge in demand.
January is often the month when the political and fiscal agenda for the year is set. In 2026, a mid-term election year in the U.S., the January market often reacts to the clarity (or lack thereof) regarding potential shifts in congressional power and tax policy.
Investors are human. A strong January builds confidence, leading to a "fear of missing out" (FOMO) that has a history of sustaining buying pressure. A weak January creates a "wait and see" mentality that can starve the market of the “new capital” needed for a rally.
The 2026 Context: Where Do We Stand?
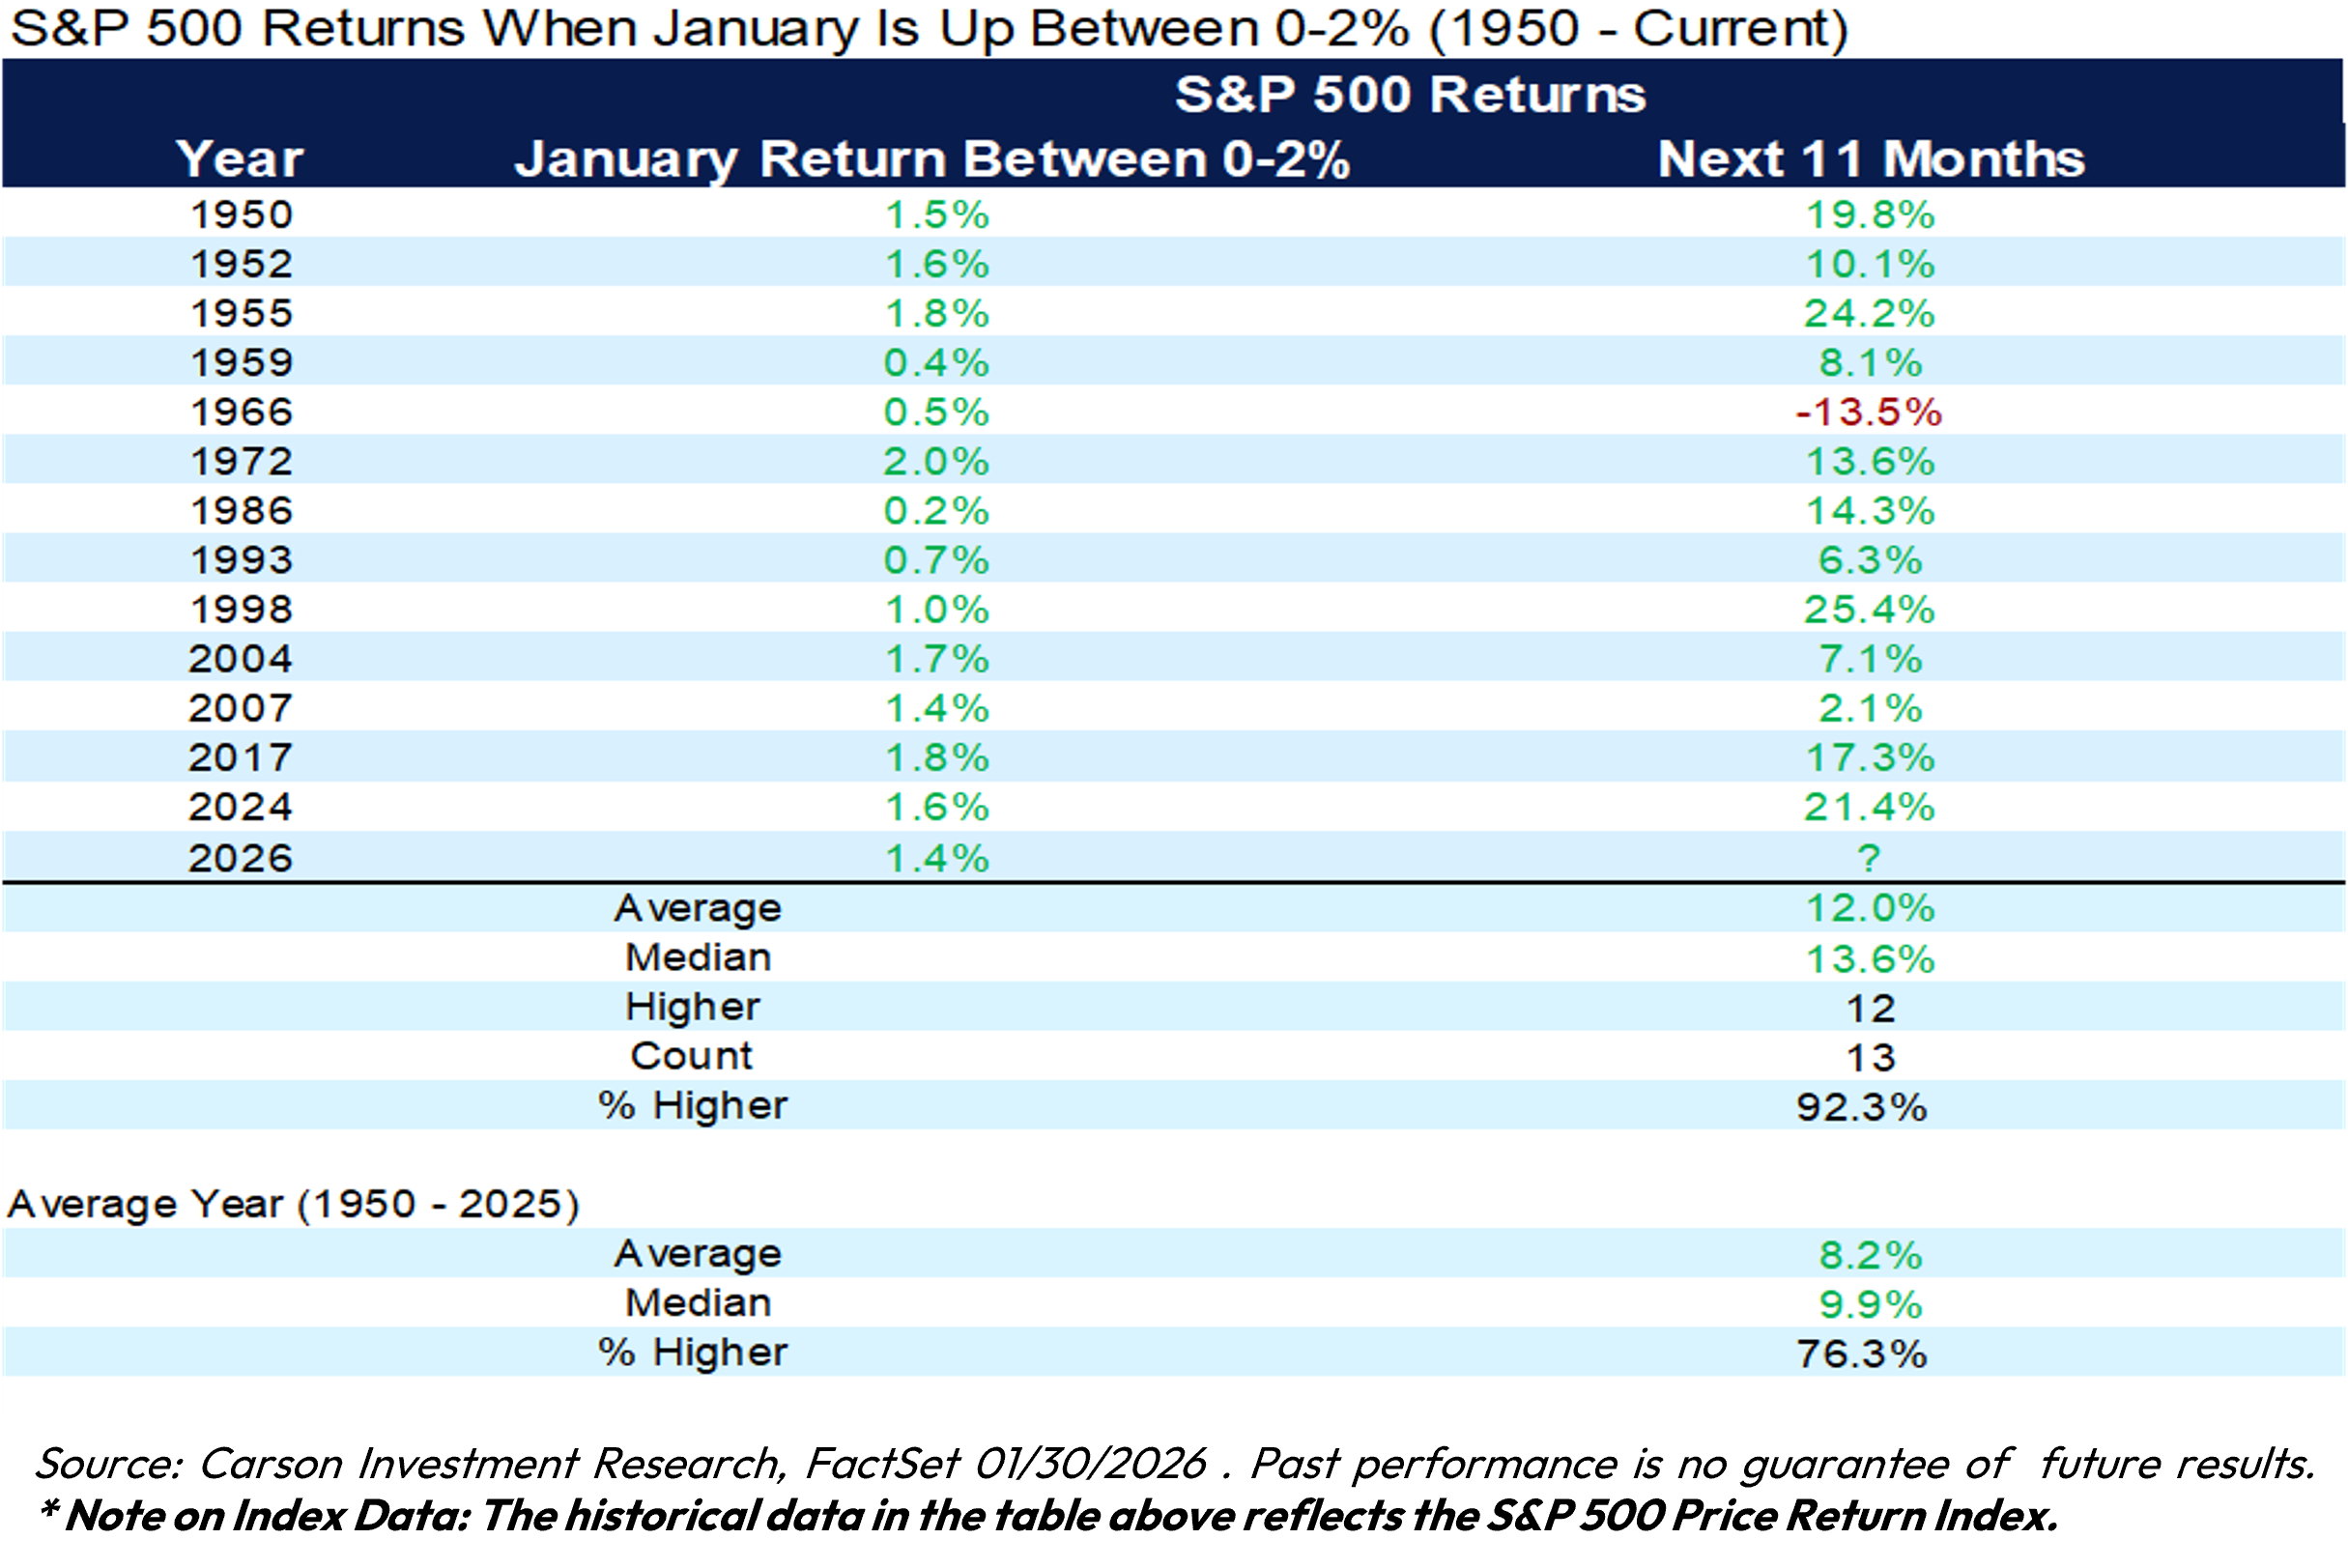
As we enter the second month of 2026, the S&P 500 has just closed a January that produced a 1.5% gain, exceeding most expectations. It seemingly did so for two major reasons: margin expansion from AI-driven automation and tamer inflation without a collapse in employment.
We believe, however, that we must apply a bit of skepticism, for while the January barometer has a very good historical record we believe this January rally contained other important information that can be used to understand what may lie ahead for markets in 2026. To delve deeper into our discussion on the "January Barometer," we need to discuss the market internals of January 2026. While the S&P 500’s 1.5% gain provides the headline, the real story of the year is found in the massive divergence between sectors and styles.
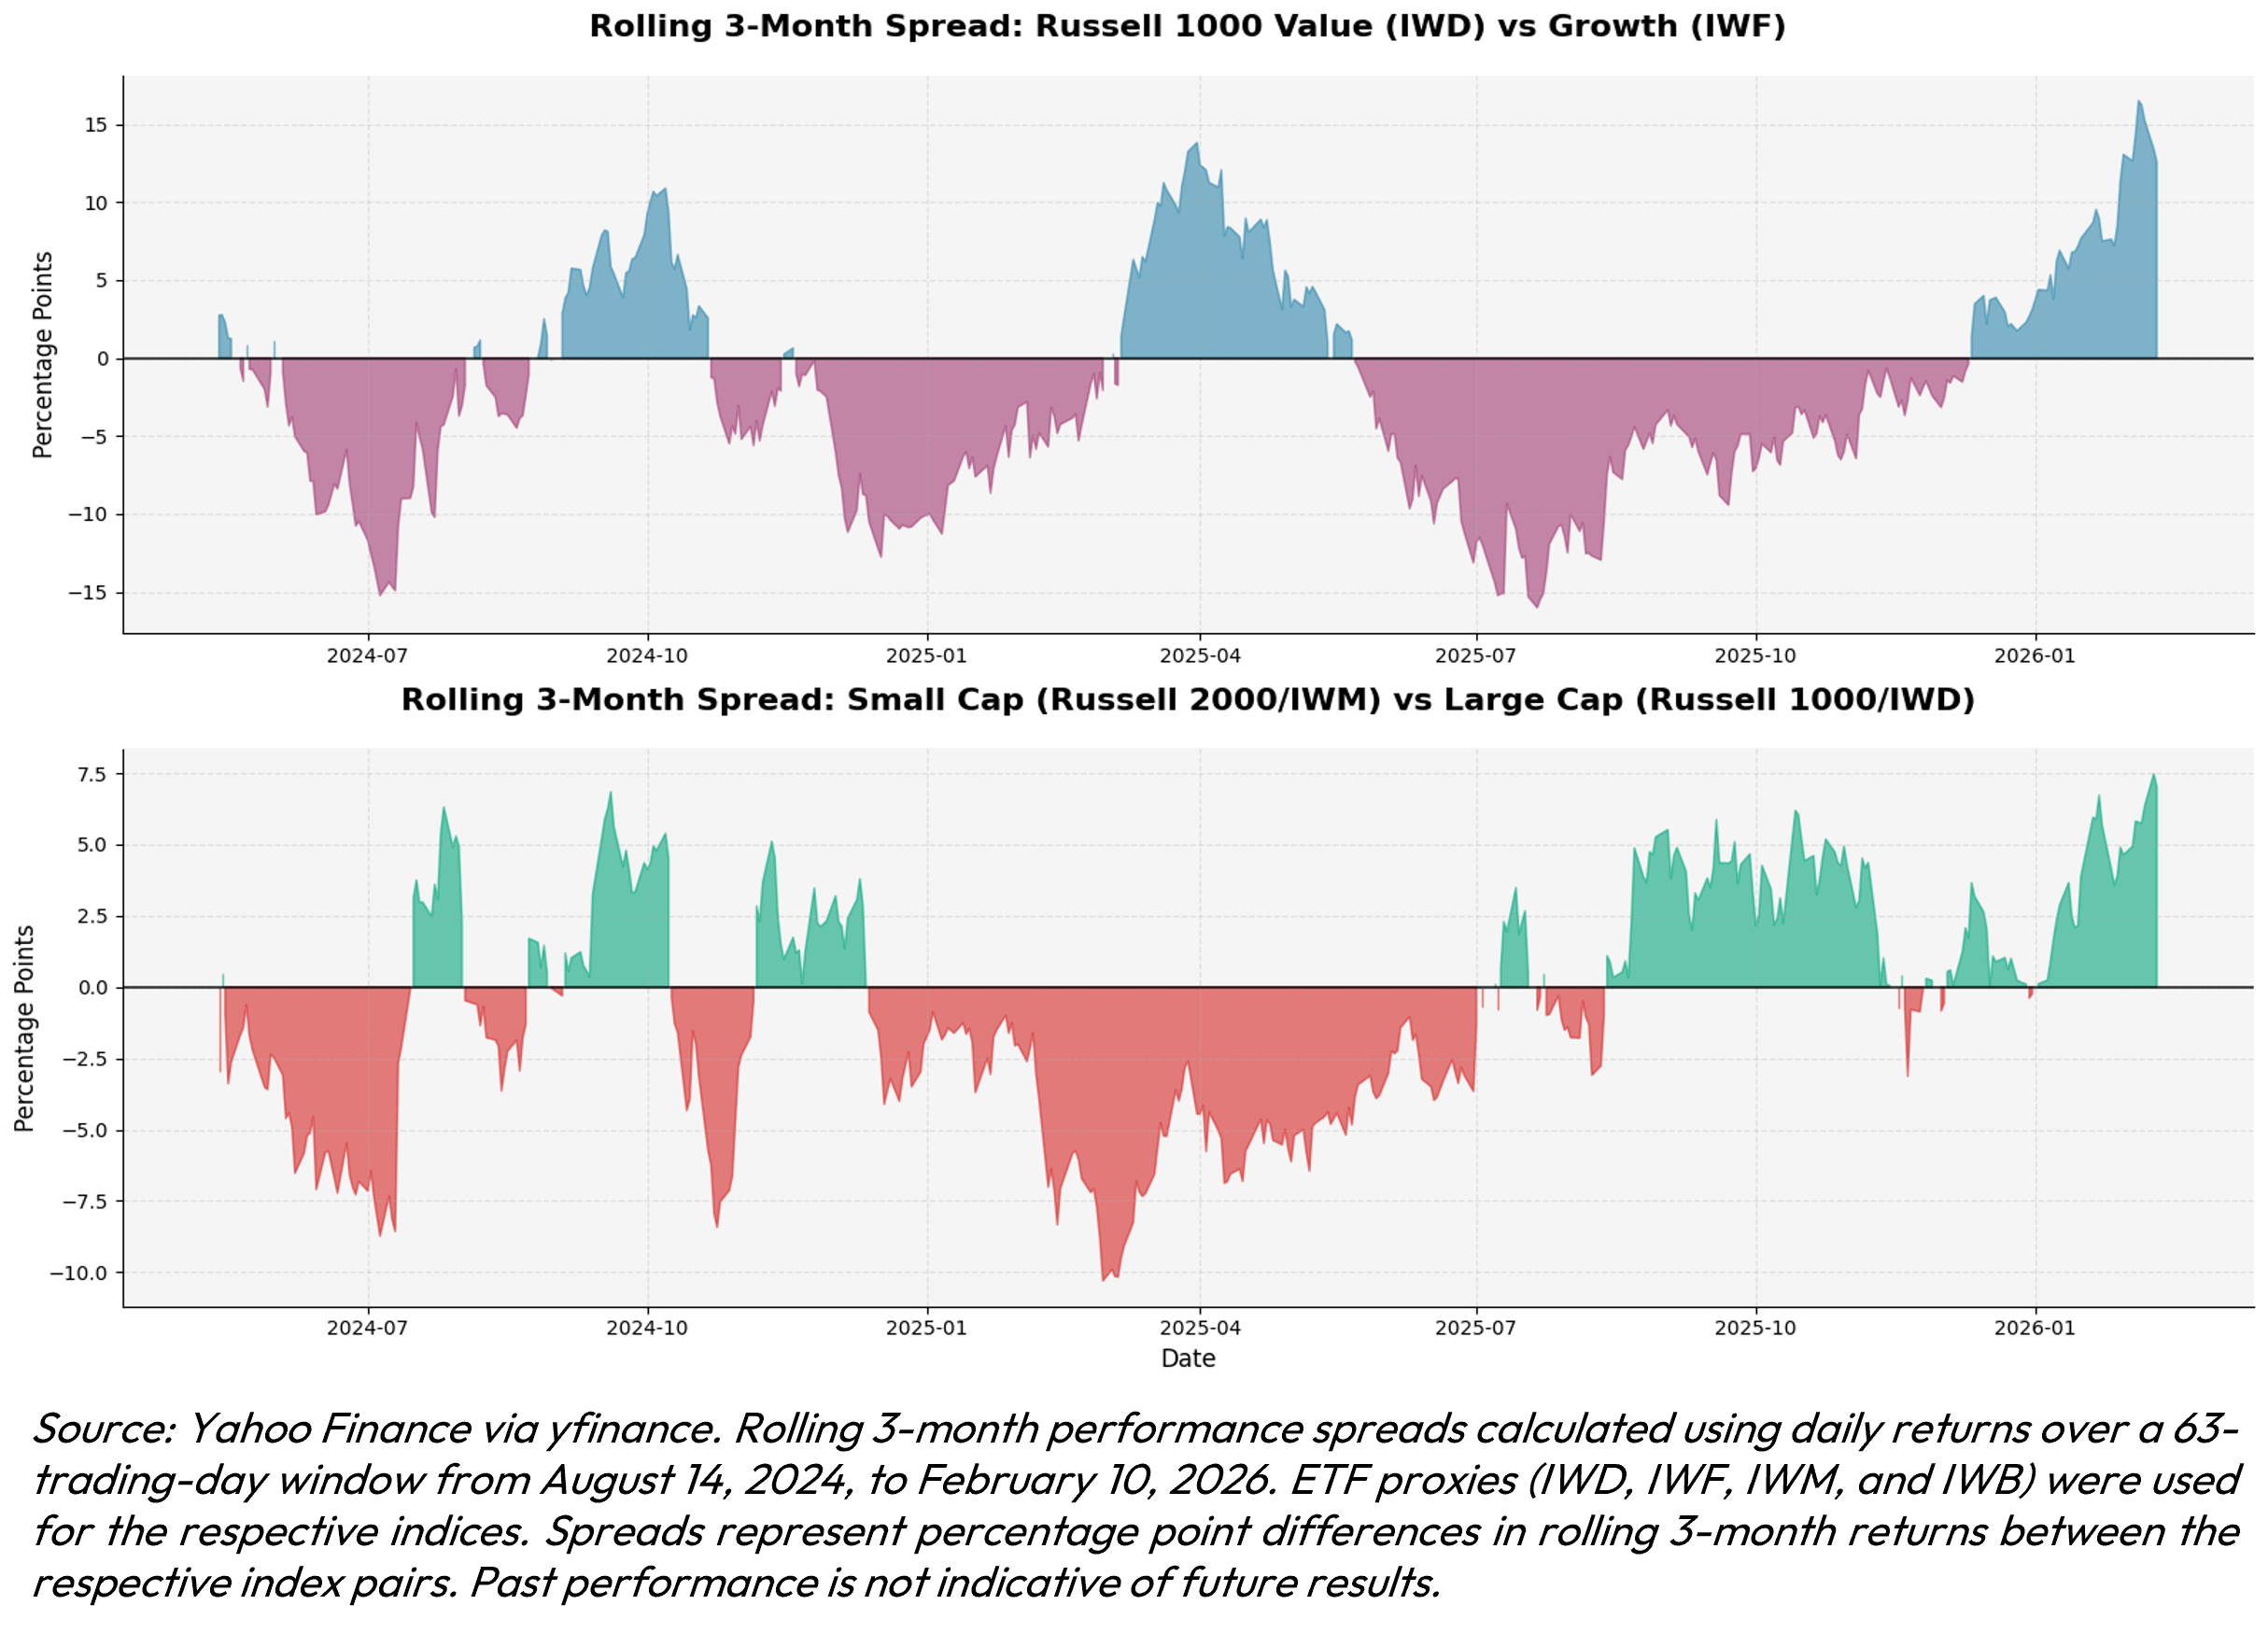
This January was marked by a violent rotation that took place under the surface of the headlines. Energy, industrials and materials were the dominant sectors for January, sectors normally associated with strong underlying economic growth. In the trailing position for the month were financials, health care and technology, the latter primarily struggling because of weakness in software offset by strength in semiconductors.
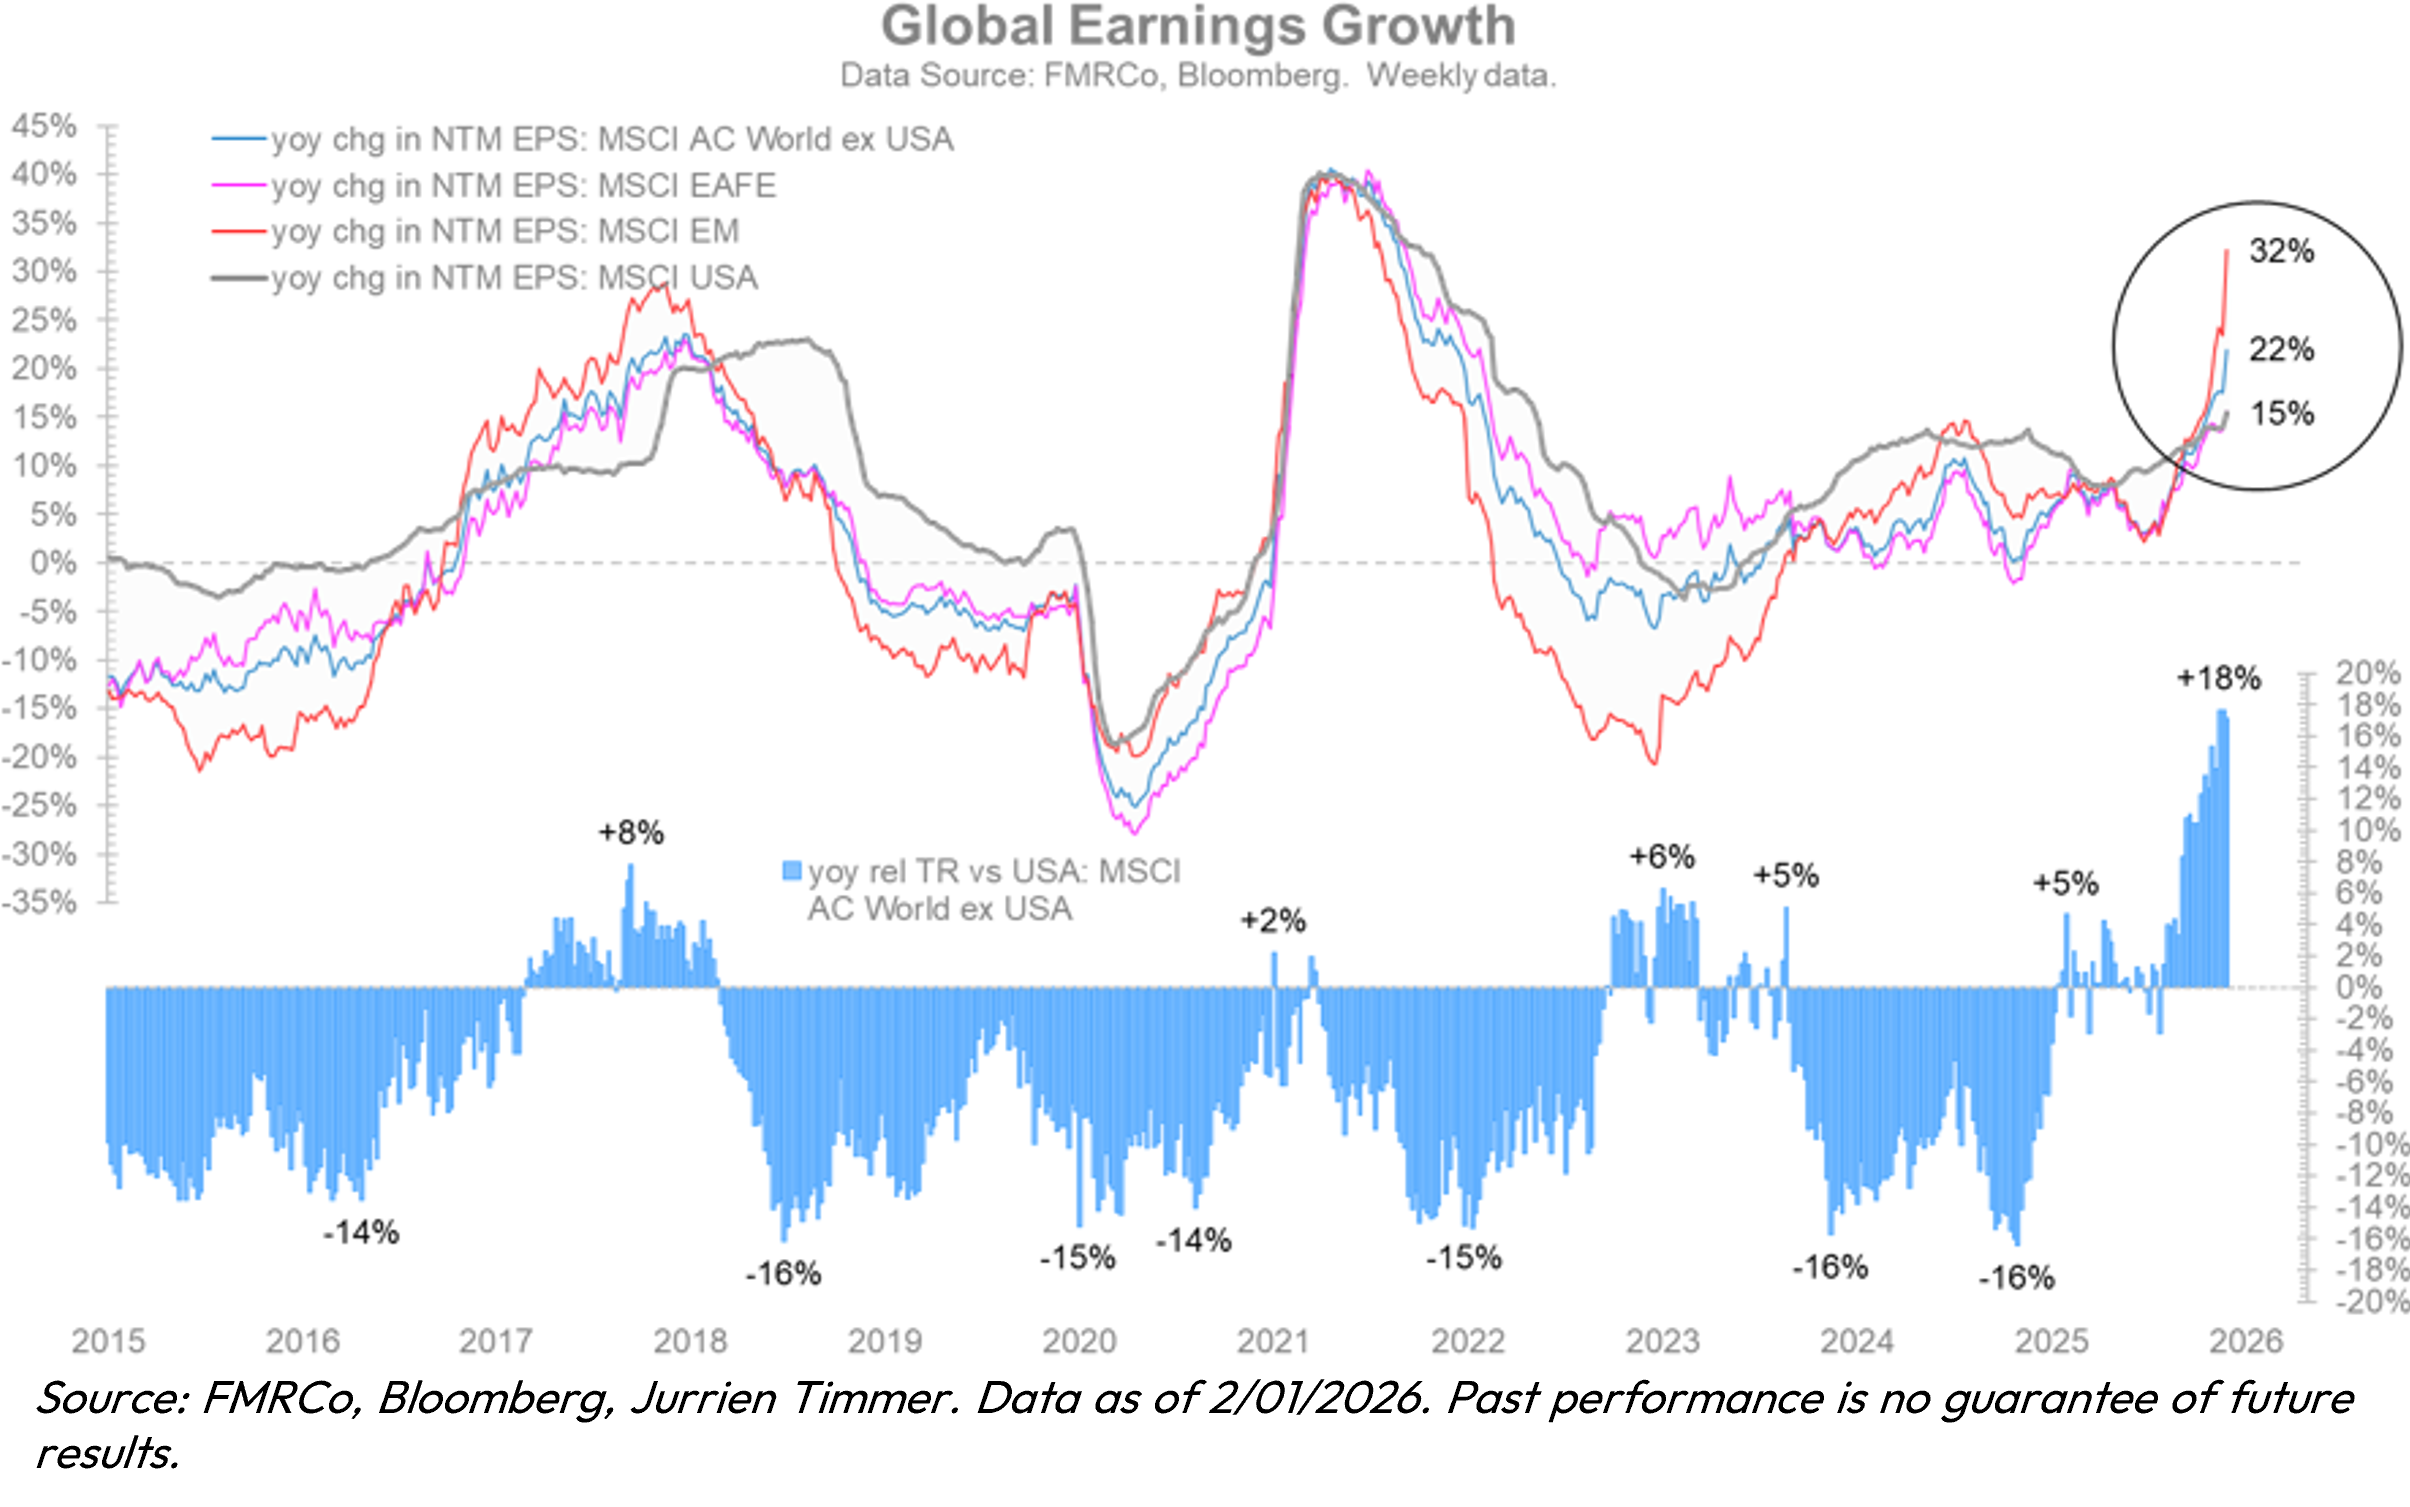
But while monthly sectors ranking can come and go, the real attention grabber for us was the fact that large capitalization US stocks was the worst performing style for the month. International, Emerging Markets, US Small Cap and US Mid Cap all outperformed. We believe this will prove to be the beginning of a change in trend that began happening in late 2025 and has continued into this year.
We say this for a few reasons. The first is that valuations, which continue to be stretched and most likely will lead to more modest returns at the index level here in the US. Sentiment for AI stocks (through high P/E multiples) remains high and could mean that further gains are harder to come by. The dollar could continue its recent weakness, giving the advantage to non-dollar assets like international to continue to outperform. AI may move from benefiting the companies that supply it to the companies that use and benefit from it. This could mean a continued, dramatic shift from new economy companies doing well to old economy companies reaping the benefits of AI through productivity gains and margin enhancement.
We are thus advising clients to continue to rebalance portfolio and to take some profits from the winners of the past few years. We want to make sure that you have exposure to asset classes that have been underperforming, and to diversify away from Large Cap US and to skate to where we believe the puck is going to be over the next several quarters and years. After years of mega-cap dominance, the "average" stock is finally participating in the rally. This is a very healthy sign for the "So goes January" theory, as it suggests the market isn't just being propped by a few companies, but instead is reaching the next phase of its development.

Elyxium Wealth LLC (“the FIRM ”) is a registered investment adviser located in Beverly Hills, California. The FIRM may only transact business in those states in which it is registered, or qualifies for an exemption or exclusion from registration requirements.
This presentation is limited to the dissemination of general information regarding the FIRM’s investment advisory services. Accordingly, the information in this presentation should not be construed, in any manner whatsoever, as a substitute for personalized individual advice from the FIRM. Information presented is for educational purposes only and does not intend to make an offer or solicitation for the sale or purchase of any specific securities, investments, or investment strategies. Investments involve risk and unless otherwise stated, are not guaranteed. Be sure to first consult with a qualified financial adviser and/or tax professional before implementing any strategy discussed herein. Any client examples were hypothetical and used to demonstrate a concept.
Past performance is not indicative of future performance. Therefore, no current or prospective client should assume that future performance of any specific investment, investment strategy (including the investments and/or investment strategies recommended by the FIRM), or product referenced directly or indirectly in this presentation, will be profitable. Different types of investments involve varying degrees of risk, & there can be no assurance that any specific investment or investment strategy will suitable for a client’s or prospective client’s investment portfolio.
INV-260217